
Foreign Exchange Reserves
The usable foreign exchange reserves increased by 3.85% to USD 9,219 million (4.7 months of import cover). This remains above the CBK’s statutory requirement to endeavor to maintain at least 4.0-months of import cover and the EAC region’s convergence criteria of 4.5-months of import cover.
Currency
The Kenyan Shilling appreciated against the Dollar, the Sterling Pound and the Euro to exchange at KES 129.21, KES 160.09 and KES 133.90 respectively. The observed appreciation against the Dollar is attributed to increased foreign inflows.
| Currency | YTD Change | W-o-W Change |
|---|---|---|
| Dollar | -0.07% | -0.01% |
| Sterling Pound | -1.30% | -0.40% |
| Euro | -0.61% | -0.44% |
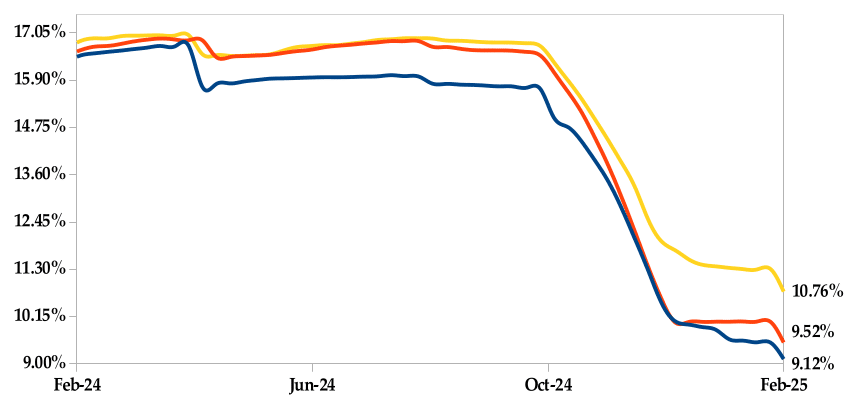
Liquidity
Liquidity in the money markets increased, with the average inter-bank rate decreasing from 11.22% to 10.90%, as government payments more than offset tax remittances. Open market operations remained active.
| Liquidity | Week (previous) | Week (ending) |
|---|---|---|
| Interbank rate | 11.22% | 10.90% |
| Interbank volume (billion) | 22.25 | 14.29 |
| Commercial banks’ excess reserves (billion) | 16.70 | 17.30 |
Fixed Income
T-Bills
T-Bills were over-subscribed during the week, with the overall subscription rate increasing to 296.60% from 56.09% recorded in the previous week. The 364-day T-Bill received the highest subscription rate at 371.85%, while the 91-day T-Bill and 182-day T-Bill had subscription rates of 250.00% and 239.98% respectively. The acceptance rate decreased by 13.68% to close the week at 83.92%.
T-Bonds
In the secondary bond market, there was a higher demand for the week’s bond offers. Bond turnover increased by 38.75% from KES 28.04 billion in the previous week to KES 38.91 billion. Total bond deals increased by 27.78% from 540 in the previous week to 690.
In the primary bond market, CBK issued a prospectus for the buyback of FXD1/2022/003 & FXD1/2020/005 treasury bonds and IFB1/2016/09 infrastructure bond seeking to raise KES 50 billion, through a multi-price reverse auction method. The coupon rates are 11.77%, 11.67% and 12.50% respectively. The period of sale for eligible investors runs from 07/02/2025 to 17/02/2025. The redemption dates for these bonds are 07/04/2025, 05/05/2025 and 12/05/2025 respectively.
Eurobonds
In the international market, yields on Kenya’s Eurobonds decreased by an average of 0.21% compared to the previous week, by 0.35% month-to-date and by 0.34% year-to-date. The yields on the 10- year Eurobonds for both Angola and Ivory Coast decreased.
| Bond | YTD Change | M-o-M Change | W-o-W Change |
|---|---|---|---|
| 2018 10-Year Issue | -0.48% | -0.48% | -0.33% |
| 2018 30-Year Issue | -0.18% | -0.20% | -0.12% |
| 2019 7-Year Issue | -0.33% | -0.31% | -0.20% |
| 2019 12-Year Issue | -0.38% | -0.40% | -0.19% |
| 2021 13-Year Issue | -0.35% | -0.36% | -0.20% |
| 2024 6-Year Issue | -0.35% | -0.32% | -0.22% |
Equities
NASI, NSE 20, NSE 25 and NSE 10 settled 1.01%, 1.48%, 2.12% and 2.13% higher respectively compared to the previous week, bringing the year-to-date performance to 3.38%, 6.60%, 1.47% and 0.99% respectively. Market capitalization also gained 2.61% from the previous week to close at KES 2.04 trillion, recording a year-to-date increase of 3.38%. The performance was driven by gains recorded by large-cap stocks such as KCB, Safaricom and Stanbic of 5.38%, 4.36% and 3.24% respectively. This was however weighed down by the loss recorded by Co- operative Bank of 3.02% .
The Banking sector had shares worth KES 1B transacted while the Energy and Petroleum sector had shares worth KES 141.90M transacted. Manufacturing & Allied sector had shares worth KES 123M transacted while Safaricom had shares worth KES 1B transacted.
Top Gainers and Losers in the Equities Markets
| Top Gainers | YTD Change | W-o-W |
|---|---|---|
| Home Afrika | 175.68% | 47.83% |
| Uchumi | 137.50% | 35.71% |
| Standard group | 27.86% | 27.60% |
| Eveready | 28.21% | 23.97% |
| HF group | 73.91% | 19.40% |
| Losers | YTD Change | W-o-W |
|---|---|---|
| Limuru tea | -14.00% | -8.79% |
| KPLC | 34.36% | -7.94% |
| Sanlam | 31.72% | -7.91% |
| Kakuzi Plc | 2.04% | -7.83% |
| B.O.C Kenya | -9.86% | -6.98% |
Alternative Investments
| Week (previous) | Week (ending) | % Change | |
|---|---|---|---|
| Derivatives Turnover (million) | 1.38 | 3.14 | 127.34% |
| Derivatives Contracts | 10.00 | 5.00 | -50.00% |
| I-REIT Turnover (million) | 0.00 | 0.00 | 0.00% |
| I-REIT deals | 0.00 | 0.00 | 0.00% |
Global and Regional Markets
| Global Markets | YTD Change | W-o-W |
|---|---|---|
| S&P 500 | 2.68% | -0.24% |
| Dow Jones Industrial Average (DJI) | 4.51% | -0.54% |
| FTSE 100 (FTSE) | 5.33% | 0.31% |
| STOXX Europe 600 | 6.28% | 0.60% |
| Shanghai Composite (SSEC) | 1.26% | 2.30% |
| MSCI Emerging Markets Index | 2.97% | 1.38% |
| MSCI World Index | 3.37% | -0.10% |
| Continental Markets | YTD Change | W-o-W |
|---|---|---|
| FTSE ASEA Pan African Index | 6.02% | 0.81% |
| JSE All Share | 5.06% | 2.36% |
| NSE All Share (NGSE) | 2.67% | 1.38% |
| DSEI (Tanzania) | 6.33% | 2.39% |
| ALSIUG (Uganda) | 6.95% | -1.05% |
Global and Continental Markets
The US stock market closed the week on a downward trajectory, as losses in the consumer services, consumer goods and basic materials sectors led shares lower.
European stock markets closed the week in the green zone, buoyed by mining companies in the lead following a raft of upbeat earnings reports.
Asian stock markets closed the week higher, as the broader tech sector rose tracking Wall Street gains. However, escalating US and China trade tensions tempered overall optimism.
On the global commodities markets, Crude Oil WTI and ICE Brent Crude closed the week 2.11% and 2.74% lower at $71.00 and $74.66 respectively. Gold futures prices settled 1.86% higher at $2,887.60.
Week’s Highlights
- The Monetary Policy Committee (MPC) met on 5th February 2025, and lowered the Central Bank Rate (CBR) from 11.25% to 10.75%, alongside a reduction in the Cash Reserve Ratio (CRR) from 4.25% to 3.25%. The move aims to support economic growth after a slowdown in 2024 while maintaining exchange rate stability. Inflation is expected to remain low, aided by stable core inflation and energy prices. The CRR cut will increase bank liquidity, reducing borrowing costs and encouraging private sector lending.
- Fitch Ratings has affirmed Kenya’s sovereign rating at “B-” with a Stable Outlook, citing strong economic growth and monetary policy. However, challenges such as high debt costs, weak governance and a large informal sector persist. Fitch expects Kenya’s fiscal deficit to widen to 4.8% of GDP in 2025, with rising sovereign funding needs. The recent Eurobond issuance helped ease liquidity pressures, but revenue shortfalls remain a concern.
- The Stanbic PMI dropped slightly from 50.6 in December to 50.5 in January 2025, marking the fourth consecutive month of private sector expansion. Business growth continued with higher output and new orders, driven by marketing efforts and improved cash flow. However, rising input costs led to increased prices and employment levels declined for the first time since August. Despite ongoing growth, business optimism remained weak, with only 6% of firms expecting a positive outlook.
- 5 Actuarial Services E.A. Limited 1113 Kayahwe Rd, Off Galana Rd, Kilimani, P. O. Box 10472 – 00100 NAIROBI, KENYA Tel. +254 202 710 028 / Cell: +254 111 037 100 / +254 708 710 028 / +254 785 710 028 Office Email: info@actserv-africa.com Website: www.actserv.co.ke Equity Bank and IFC have launched a $20 million Risk Sharing Facility (RSF) to boost unsecured microlending in 14 marginalized Kenyan counties, including Turkana and Garissa. Targeting refugees and host communities, the initiative aims to expand credit access, foster entrepreneurship and drive regional development. Equity Bank and IFC will share 50% of the risk, with IFC also providing advisory services.
- The S&P Global US Composite PMI fell to 52.7 in January 2025 from 55.4 in December, slightly exceeding the initial estimate of 52.4. This marked the lowest level since April 2024, though business activity continued expanding. A rebound in manufacturing output offset a slowdown in services. New business growth eased, while employment rose at its fastest pace since June 2022. Inflationary pressures increased, with both input costs and output prices rising more quickly.
- The HCOB Eurozone Composite PMI climbed to 50.2 in January 2025 from 49.6 in December, aligning with preliminary estimates and surpassing market expectations of 49.7. This marks the first expansion in private sector activity since August 2024. Growth was driven by continued expansion in services and a slower contraction in manufacturing. Despite an ongoing decline in new business, backlogged orders sustained output. Employment levels saw only a slight decline, while input costs surged to a 21-month high, leading to higher output prices. Business optimism remained positive.
- China’s annual inflation rate rose to 0.5% in January 2025 from 0.1% in December, exceeding forecasts of 0.4% and reaching its highest level since August 2024. The increase was driven by Lunar New Year demand, government stimulus and accommodative monetary policy. Food prices rebounded, led by higher pork and vegetable costs, while non-food prices also rose, particularly in housing, healthcare and education. Transport costs fell at a slower rate. Monthly, CPI climbed 0.7%, marking its highest increase in 11 months but below estimates of 0.8%.
Get future reports
Please provide your details below to get future reports: