MONTH’S HIGHLIGHTS
- Inflation eased to 2.7% in October 2024 from 3.55% in September, remaining below the midpoint of the central bank’s target range. This was primarily driven by decreased fuel prices. The transport index declined by 0.3% month-on-month due to decrease in prices of petrol and diesel. The housing, water, electricity, gas and other fuels index also decreased by 0.3% month-on-month due to decrease in prices of kerosene and LPG. On the flip side, the food and non-alcoholic beverages index increased by 0.5% month-on-month due to an increase in food prices.
- The Monetary Policy Committee (MPC) of the Central Bank of Kenya lowered the benchmark lending rate to 12% from 12.75% at its 8th October meeting. This decision was based on a decline in inflation, easing global interest rates and concerns about slowing economic growth. The MPC also noted the slowdown in credit to the private sector and economic growth in Q2 2024, suggesting a need for further monetary policy easing to support economic activity while maintaining exchange rate stability. The next committee meeting is scheduled for December 2024.
- Kenya secured a $606 million loan from the IMF to support its economic recovery and build fiscal buffers. The IMF’s approval comes after the successful completion of several program reviews, including the Extended Fund Facility, Extended Credit Facility and Resilience & Sustainability Facility. While the IMF recognises Kenya’s efforts to stabilise its currency and rebuild reserves, it also highlights ongoing challenges such as revenue shortfalls and resistance to tax measures.
- Kenya’s GDP fell to a 2-year low, growing 4.6% year-on-year in the second quarter of 2024, from a 5% expansion in the previous quarter. Protests against proposed tax increases disrupted various activities, impacting the economy. The agricultural sector, a key driver, grew at a slower pace despite increased production of certain crops. Other sectors including mining and construction also experienced slower growth. Additionally, the IMF projects Kenya’s economic growth as measured by real GDP, to decline from 5.6% in 2023 to 5.0% in both 2024 and 2025, making Kenya the only middle-income African economy not expected to rebound by 2025. In contrast, the IMF forecasts moderate recoveries for South Africa and Ghana, with South Africa’s growth improving from 1.1% in 2023 to 1.5% by 2025 and Ghana’s from 3.1% in 2024 to 4.4% in 2025. Kenya’s inflation is expected to decrease to 4.5% in 2024 from 6.6% in 2023, but is anticipated to edge up again to 5.3% by the end of 2025.
- The European Central Bank (ECB) lowered its key interest rates by 25 basis points in October 2024, as expected. This follows similar moves in September and June. The decision was primarily due to an updated assessment of inflation, which is now below the ECB’s 2% target. While wage growth remains high, inflationary pressures are easing. The ECB remains committed to maintaining restrictive rates to ensure inflation returns to its medium-term goal while adopting a data-driven and flexible approach.
- The Eurozone economy grew by 0.4% in the third quarter of 2024, marking the strongest quarterly growth in two years. This was driven by improved performance in several major economies, including Germany, France and Spain. While Italy’s economy stalled and Latvia continued to contract, other countries like Portugal, Ireland and Lithuania experienced positive growth. The Eurozone’s annual GDP growth for 2024 is now projected to be 0.8%.
- Eurozone inflation rose to 2% in October 2024, reaching the European Central Bank’s target. This increase was primarily due to base effects from last year’s sharp decline in energy prices. While energy prices continued to fall, albeit at a slower pace, prices for food, alcohol and non-energy industrial goods rose faster. Core inflation remained steady at 2.7%.
- US GDP grew an annualised 2.8% in Q3 2024, below 3% in Q2 and market forecasts of 3%. While consumer spending, particularly on goods and services, and government spending contributed positively to growth, investment in structures and residential property declined. Net trade also made a positive contribution. Overall, the US economy continued to expand, albeit at a slower pace.
ECONOMIC INDICATORS
Foreign Exchange Reserves
During the month, the usable foreign exchange reserves increased by 6.96% to settle at $8.59 billion (4.40 months of import cover). This was above the CBK’s statutory requirement to endeavor to maintain at least 4 months of import cover but below EAC region’s convergence criteria of 4.5 months of import cover.
Currency
The Kenyan Shilling remained stable against the USD, but appreciated against the Sterling Pound and the Euro by 3.30% and 2.82%, exchanging at Kshs 129.20, Kshs 167.32 and Kshs 140.18 respectively at the end of the month, from Kshs 129.20, Kshs 173.03 and Kshs 144.24 in the previous month. The observed stabilisation of the Kenyan Shilling is attributed to increased foreign inflows and purchase of Dollars by the Central Bank.
USD Vs KSHS

STERLING POUND & EURO Vs KSHS

Inflation
The overall year-on-year inflation decreased to 2.73% in October 2024 from 3.55% in September. This was primarily driven by lower fuel prices.
INFLATION EVOLUTION

Liquidity
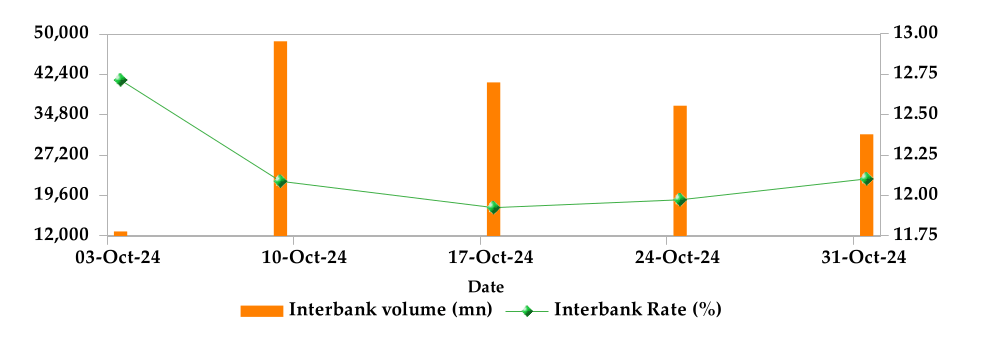
During the month, liquidity increased as a result of government payments which more than offset tax remittances. The average inter-bank rate decreased from 12.68% to 12.15%. The volume of inter-bank transactions increased from Kshs 26.53 billion to Kshs 34.10 billion. Commercial banks excess reserves increased from Kshs 12.40 billion to Kshs 39.50 billion.
INTER-BANK RATE and VOLUME

FIXED INCOME
T-Bills
T-bills recorded an overall subscription rate of 296.55% during the month of October, compared to 116.24% recorded in the previous month. The performance of the 91-day, 182-day and 364-day papers stood at 512.34%, 269.16% and 237.61% respectively. On a monthly basis, yields on the 91-day, 182-day and 364-day papers decreased by 11.15%, 12.45% and 10.90% to 13.97%, 14.52% and 14.97% respectively.
T-BILLS

T-Bonds
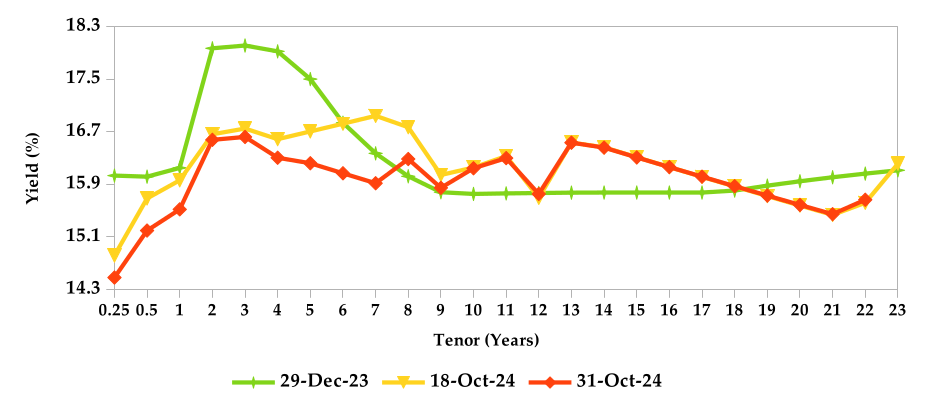
During the month, T-Bonds registered a total turnover of Kshs 120.80 billion from 2,482 bond deals. This represents a monthly decline of 9.29% and 4.13% respectively. The yields on government securities in the secondary market also decreased during the month of October.
In the primary bond market, CBK reopened FXD1/2022/10 for the second time in an effort to raise Kshs 15.0 billion. Additionally, the CBK re-issued three bonds FXD1 /2023/10, FXD1/2022/15 and FXD1/2024/10 with coupon rates of 14.15%, 13.94% and 16.00% respectively, targeting to raise Kshs 45 billion. The period of sale for FXD1/2023/10 and FXD1/2022/15 runs from 25th October to 6th November, while the sale for FXD1/2024/10 runs from 25th October to 13th November.
In the international market, yields on Kenya’s Euro bonds increased by an average of 24 basis points.
YIELD CURVE

EQUITIES
During the month, market capitalization gained 9.83% to settle at Kshs 1.84 trillion. Total shares traded increased by 14.41% to 382.17 million shares and equity turnover decreased by 1.55% to close at Kshs 4.94 billion. On a monthly basis, NASI, NSE 20, NSE 25 and NSE 10 settled 9.83%, 7.31%, 10.06% and 10.14% higher respectively. The performance was as a result of gains recorded by large cap stocks such as EABL, Safaricom, KCB, Standard Chartered and Stanbic of 18.26%, 11.67%, 10.95%, 10.48 and 10.02% respectively.
NASI and NSE 10

Market Capitalization, NSE 20 and NSE 25

ALTERNATIVE INVESTMENTS
GLOBAL AND REGIONAL MARKETS
| Global Markets | Monthly Change | YTD Change |
|---|---|---|
| S&P 500 | -0.99% | 20.30% |
| STOXX Europe 600 | -3.35% | 5.62% |
| Shanghai Composite (SSEC) | -1.70% | 10.72% |
| MSCI Emerging Market Index | -4.38% | 9.26% |
| MSCI World | -2.04% | 15.08% |
| Regional Markets | Monthly Change | YTD Change |
|---|---|---|
| FTSE ASEA Pan African Index | 0.90% | 3.51% |
| JSE All Share | -1.50% | 11.52% |
| NSE All Share (NGSE) | -0.92% | 28.50% |
| DSEI (Tanzania) | 4.64% | 25.42% |
| ALSIUG (Uganda) | 6.11% | 33.21% |
Get future reports
Please provide your details below to get future reports: