MONTH’S HIGHLIGHTS
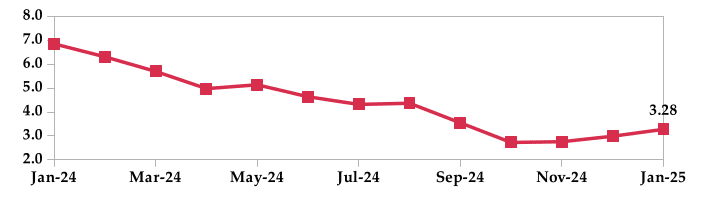
- Inflation increased to 3.28% in January 2025 from 2.99% in December 2024. This was primarily driven by higher food and kerosene prices. The food and non-alcoholic beverages index increased by 1.6%, driven by higher food prices. The housing, water, electricity, gas and other fuels index increased by 0.1% mainly due to increase in kerosene prices. However, despite the increase in diesel and petrol prices, the transport index decreased by 0.4% mainly due to decreased bus/matatu fares.
- Fitch Ratings maintained Kenya’s sovereign credit rating at ‘B-‘ with a Stable Outlook. While citing solid growth prospects and a stronger monetary policy, Fitch highlighted constraints such as high debt costs, weak governance and a large informal sector. Despite efforts to narrow the budget deficit, Kenya continues to grapple with high external debt levels and fiscal consolidation challenges.
- Kenya’s economy expanded 4.0% year-on-year in Q3 2024 from 4.6% in the previous quarter, according to the data by Kenya National Bureau of Statistics (KNBS). This was primarily due to a general slowdown across the various sectors of the economy. Agriculture, contributing over a fifth of GDP, grew at a slower rate of 4.2% due to a 12.2% decline in tea production, despite gains in sugarcane and milk production. Other sectors that experienced slower growth include manufacturing, accommodation services, utilities, ICT, professional & administrative services, finance and real estate. Additionally, output contracted in the mining & quarrying and construction sectors.
- The Retirement Benefits Authority (RBA) announced significant amendments to pension laws, including an increase in the tax-deductible contribution limit to Kshs 360,000 annually from Kshs 240,000. This move aims to incentivise retirement savings and provide relief to both employees and employers. Furthermore, the RBA has introduced tax deductibility for post-retirement medical funds up to Kshs 15,000 per month, acknowledging the rising healthcare costs.
- Kenya and the United Arab Emirates (UAE) signed a comprehensive trade agreement aimed at boosting bilateral trade. The deal seeks to eliminate trade barriers and expand market access for Kenyan exports, particularly in horticulture and meat products. In return, Kenya will significantly increase imports from the UAE, including petroleum, machinery and chemicals, traditionally sourced heavily from China. This agreement has the potential to diversify Kenya’s import sources and enhance its economic ties with the UAE. Bilateral trade between the two countries reached Kshs 445 billion in 2023, with the UAE becoming Kenya’s sixth-largest export destination.
- The Federal Reserve maintained the benchmark lending rate at 4.25%-4.5% range during its January 2025 meeting, aligning with market expectations. This follows three consecutive rate cuts in 2024, totaling 100 basis points. While acknowledging ongoing economic expansion, with a stable unemployment rate and a strong labour market, Chair Jerome Powell emphasised the need for a cautious approach to further rate cuts. The Fed dropped its previous statement regarding progress towards the 2% inflation target, indicating that inflation remains somewhat elevated. It also reaffirmed its commitment to balancing price stability and maximum employment, highlighting an uncertain economic outlook.
- The Eurozone GDP grew by 0.9% year-on-year in Q4 2024, matching the previous quarter’s pace but falling below market expectations of 1%. This was driven by a deepening industrial recession, persistent high energy costs and sluggish consumer and government spending. A weakening labour market and the looming threat of a US trade war further dampened the economic outlook. Germany contracted by 0.2%, while France and Italy posted modest growth of 0.7% and 0.5% respectively. Spain outperformed with a robust expansion of 3.5%.
The European Central Bank (ECB) lowered its key interest rate by 25 bps in January 2025 as expected. This follows easing inflation pressures, aligning with the ECB’s projections. While inflation remained elevated domestically, wage growth moderated and corporate profits absorbed some inflationary impact. Despite credit conditions remaining tight, the rate cut aims to gradually ease borrowing costs. The ECB emphasised a data-dependent approach, maintaining flexibility in its policy path to ensure inflation returns to the 2% target.
ECONOMIC INDICATORS
Foreign Exchange Reserves
During the month, the usable foreign exchange reserves decreased by 3.52% to settle at $8.88 billion (4.50 months of import cover). This was above the CBK’s statutory requirement to endeavor to maintain at least 4 months of import cover and aligned with the EAC region’s convergence criteria of 4.5 months of import cover.
Currency
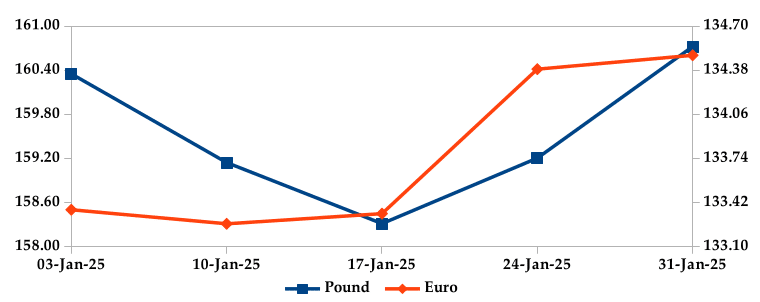
The Kenyan Shilling appreciated against the USD and the Sterling Pound but depreciated against the Euro by 0.05%, 0.95% and 0.15%, exchanging at Kshs 129.23, Kshs 160.72 and Kshs 134.49 respectively at the end of the month, from Kshs 129.29, Kshs 162.27 and Kshs 134.29 in the previous month. The observed appreciation the Dollar is attributed to increased foreign inflows.
USD Vs KSHS

STERLING POUND & EURO Vs KSHS
Inflation
The overall year-on-year inflation increased to 3.28% in January 2025 from 2.99% in December. This was primarily driven by higher food and kerosene prices.
INFLATION EVOLUTION
Liquidity
During the month, liquidity increased as a result of government payments which more than offset tax remittances. The average inter-bank rate decreased from 11.42% to 11.26%. The volume of inter- bank transactions decreased from Kshs 39.34 billion to Kshs 27.14 billion. Commercial banks excess reserves decreased from Kshs 44.00 billion to Kshs 16.70 billion.
INTER-BANK RATE and VOLUME

FIXED INCOME
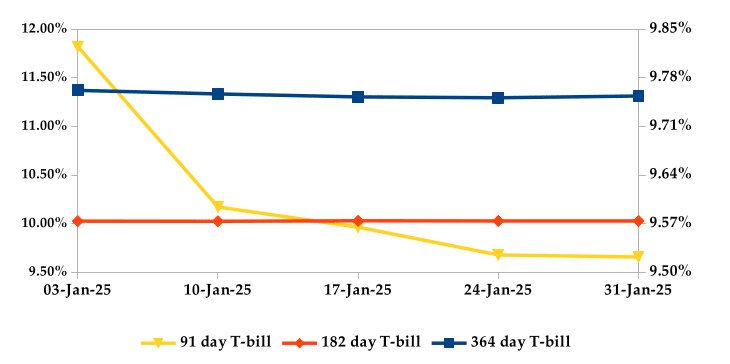
T-Bills
T-bills recorded an overall subscription rate of 94.98% during the month of January, compared to 80.06% recorded in the previous month. The performance of the 91-day, 182-day and 364-day papers stood at 219.75%, 55.84% and 84.21% respectively. On a monthly basis, yields on the 91-day and 364-day papers decreased by 3.77% and 0.85% respectively, while 182-day paper increased by 0.06% to 9.52%, 11.31% and 10.03% respectively.
T-BILLS
T-Bonds
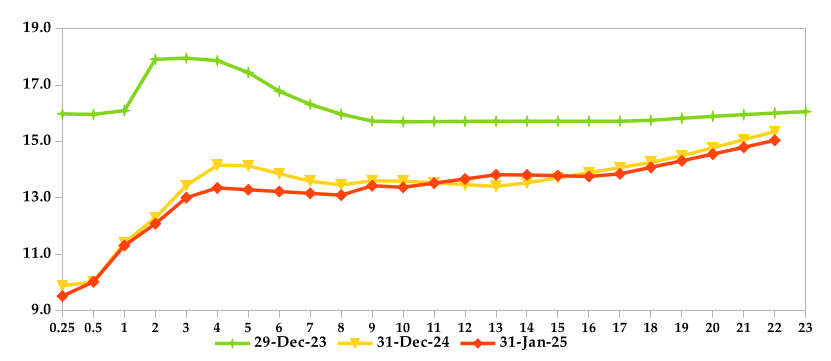
During the month, T-Bonds registered a total turnover of Kshs 157.30 billion from 2,481 bond deals. This represents a monthly increase of 30.89% and 7.96% respectively. The yields on government securities in the secondary market decreased during the month of January.
In the primary bond market, CBK re-opened IFB1/2022/14 and IFB1/2023/17 infrastructure bonds in an effort to raise Kshs 70.0 billion. The coupon rates are 13.94% and 14.40% respectively.
In the international market, yields on Kenya’s Eurobonds decreased by an average of 16 basis points.
YIELD CURVE
EQUITIES
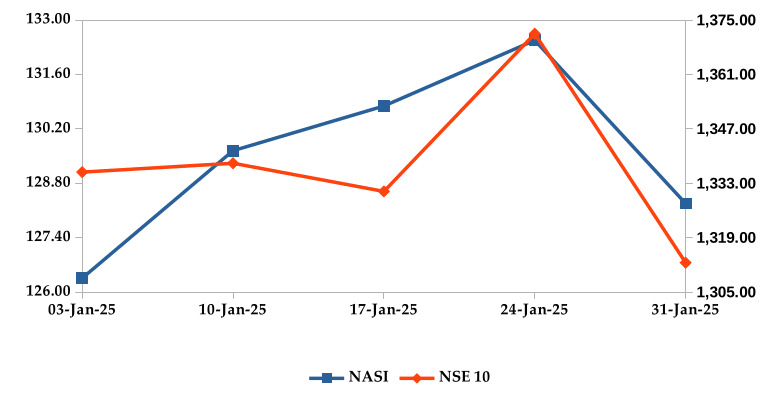
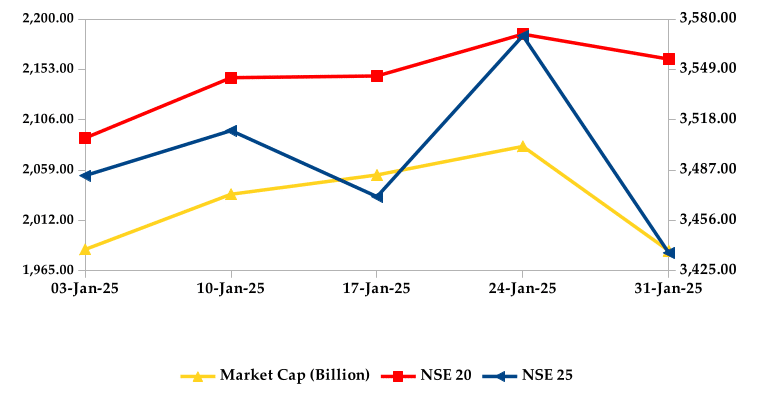
During the month, market capitalization gained 2.27% to settle at Kshs 1.98 trillion. Total shares traded decreased by 23.47% to 632.15 million shares and equity turnover decreased by 66.94% to close at Kshs 9.57 billion. On a monthly basis, NASI, NSE 20, NSE 25 and NSE 10 settled 3.89%, 7.56%, 0.98% and 0.79% higher respectively. The performance was as a result of gains recorded by large cap stocks such as EABL, KCB and Stanbic of 2.85%, 2.76% and 1.28% respectively. This was however weighed down by the loss recorded by Equity of 2.28%.
NASI and NSE 10
Market Capitalization, NSE 20 and NSE 25
ALTERNATIVE INVESTMENTS
GLOBAL AND REGIONAL MARKETS
| Global Markets | Monthly Change | YTD Change |
|---|---|---|
| S&P 500 | 2.70% | 2.93% |
| STOXX Europe 600 | 6.87% | 5.65% |
| Shanghai Composite (SSEC) | -3.02% | -0.37% |
| MSCI Emerging Market Index | 1.66% | 1.57% |
| MSCI World | 3.47% | 3.47% |
| Regional Markets | Monthly Change | YTD Change |
|---|---|---|
| FTSE ASEA Pan African Index | 5.17% | 5.17% |
| JSE All Share | 3.21% | 2.64% |
| NSE All Share (NGSE) | 1.53% | 1.28% |
| DSEI (Tanzania) | 3.70% | 3.84% |
| ALSIUG (Uganda) | 9.38% | 8.09% |
Get future reports
Please provide your details below to get future reports: