MONTH’S HIGHLIGHTS
- The Monetary Policy Committee (MPC) lowered the Central Bank Rate (CBR) to 10.75% from 11.25% during its 5th February 2025 meeting, concurrently reducing the Cash Reserve Ratio (CRR) to 3.25% from 4.25%. The move aims to support economic growth, after a slowdown in 2024, while maintaining exchange rate stability. Inflation is expected to remain low, aided by stable core inflation and energy prices. The CRR cut will increase bank liquidity, reducing borrowing costs and encouraging private sector lending.
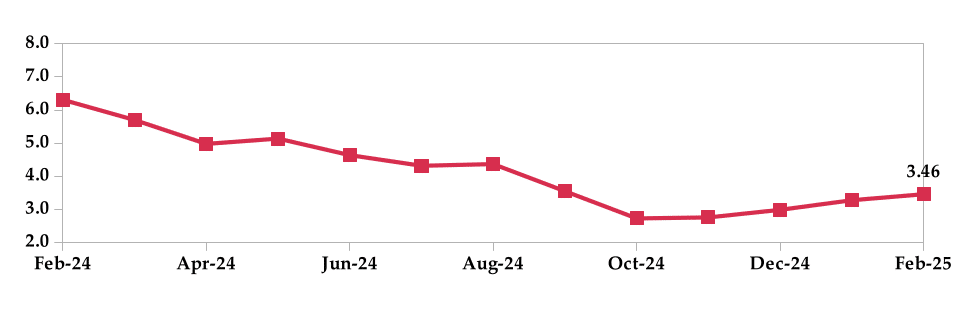
- Inflation increased to 3.46% in February 2025 from 3.28% in January. This was primarily driven by higher food and gas/LPG prices. The food and non-alcoholic beverages index increased by 0.6%, driven by higher food prices. The housing, water, electricity, gas and other fuels index increased by 0.1%, mainly due to increase in gas/LPG prices. Despite the stabilisation in diesel and petrol prices, the transport index increased by 0.1%, mainly due to elevated local flight prices.
- Kenya launched a buyback offer for its USD 900 million Eurobond maturing in May 2027, coinciding with the issuance of a new USD 1.5 billion, 11-year Eurobond. The buyback, running until 3rd March 2025, offers investors USD 1,002.50 per USD 1,000 principal amount. The new 2036 Eurobond, with a 9.5% coupon rate was heavily oversubscribed, attracting USD 4.9 billion in bids. Proceeds will refinance the 2027 Eurobond, fund general budgetary expenditures and service external debt. The 2036 bond will be amortised in three equal installments from 2034 to 2036.
- Fitch Ratings has affirmed Kenya’s sovereign rating at “B-” with a Stable Outlook, citing strong economic growth and monetary policy. However, challenges such as high debt costs, weak governance and a large informal sector persist. Fitch expects Kenya’s fiscal deficit to widen to 4.8% of GDP in 2025, with rising sovereign funding needs. The recent Eurobond issuance helped ease liquidity pressures, but revenue shortfalls remain a concern.
- Nairobi Securities Exchange (NSE) suspended trading of Bamburi Cement shares on 27th February 2025, marking the end of the cement manufacturer’s 55-year presence on the bourse. This suspension follows the successful takeover by Amsons Industries (K) Ltd, which acquired 96.54% of Bamburi’s shares on 5th December 2024. Amsons will now initiate a squeeze-out process to acquire the remaining 3.46% from minority shareholders. Trading is expected to remain halted until 9th May 2025, after which further regulatory or corporate adjustments are anticipated.
- US economy grew by 2.3% in Q4 2024, a slowdown from Q3’s 3.1%, but in line with initial estimates. Personal consumption remained the primary growth engine, increasing by 4.2%, marking its strongest rise since Q1 2023. Net trade and government spending also contributed positively, while fixed investment declined. Private inventories also weighed down the growth. For the full year 2024, the economy expanded by 2.8%.
- The S&P Global US Composite PMI fell to 50.4 in February 2025 from 52.7 in January, signaling near-stagnation and the slowest expansion since September 2023. The decline was driven by a renewed contraction in services, offsetting faster manufacturing growth. New order growth weakened, employment declined and input cost inflation reached its highest level since last September. Business optimism hit its lowest since December 2022, except for last September, amid concerns over federal policies, tariffs, rising costs and geopolitical uncertainties.
- The Caixin China General Manufacturing PMI increased to 50.8 in February 2025 from 50.1 in January, surpassing market expectations of 50.3 and reaching its highest level since November 2024. Output and new orders recorded their highest gains in three months, driven by improving market conditions, while export sales rebounded ending a two-month decline. Despite increased purchasing activity, firms struggled to fully meet production demands. Employment continued to decline, albeit at a slower pace, while backlogs persisted. Delivery times improved as logistics normalised post-Spring Festival. On the cost front, input prices edged higher, mainly due to rising copper and chemical costs, while output prices fell.
ECONOMIC INDICATORS
Foreign Exchange Reserves
During the month, the usable foreign exchange reserves increased by 2.03% to settle at $9.06 billion (4.60 months of import cover). This was above the CBK’s statutory requirement to endeavor to maintain at least 4 months of import cover and aligned with the EAC region’s convergence criteria of 4.5 months of import cover.
Currency
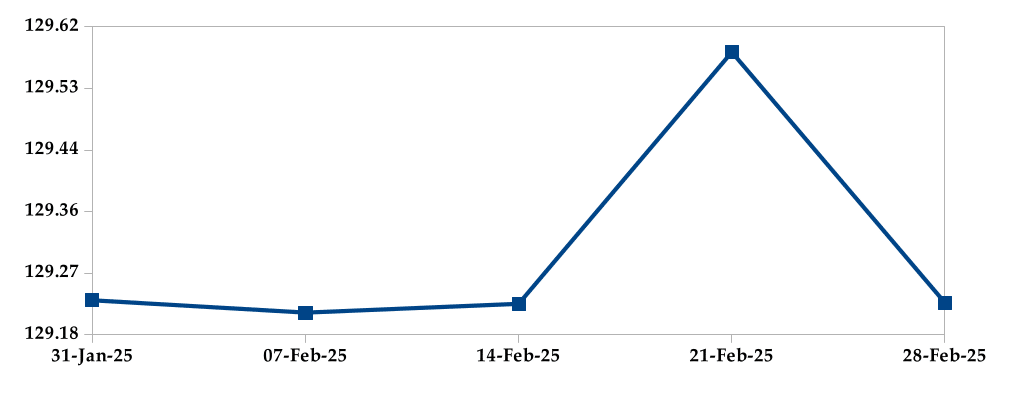
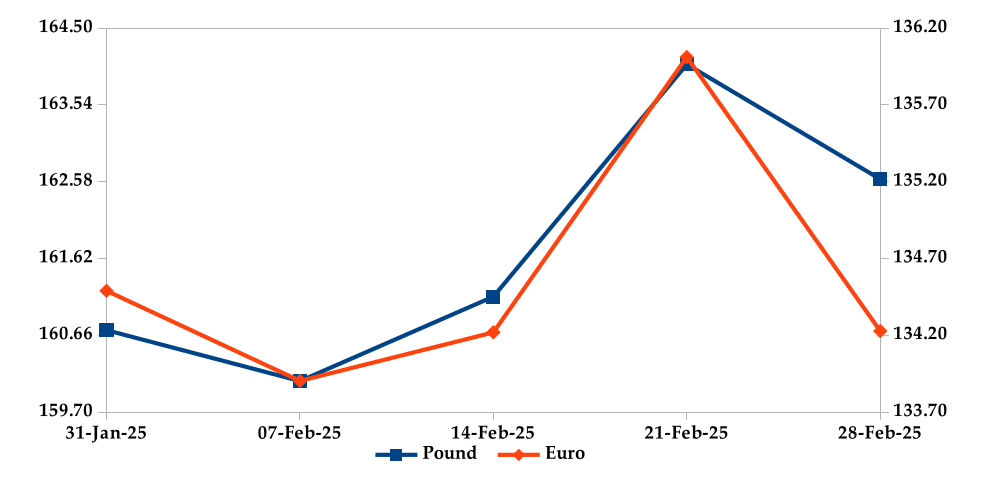
The Kenyan Shilling stabilised against the USD, appreciated against the Euro, but depreciated the Sterling Pound by 0.19% and 1.18%, exchanging at Kshs 129.23, Kshs 134.23 and Kshs 162.61 respectively at the end of the month, from Kshs 129.23, Kshs 134.49 and Kshs 160.72 in the previous month. The observed stabilisation of Kenya Shilling against the Dollar is attributed to increased foreign inflows.
USD Vs KSHS
STERLING POUND & EURO Vs KSHS
Inflation
The overall year-on-year inflation increased to 3.28% in January 2025 from 2.99% in December. This was primarily driven by higher food and kerosene prices.
INFLATION EVOLUTION
Liquidity
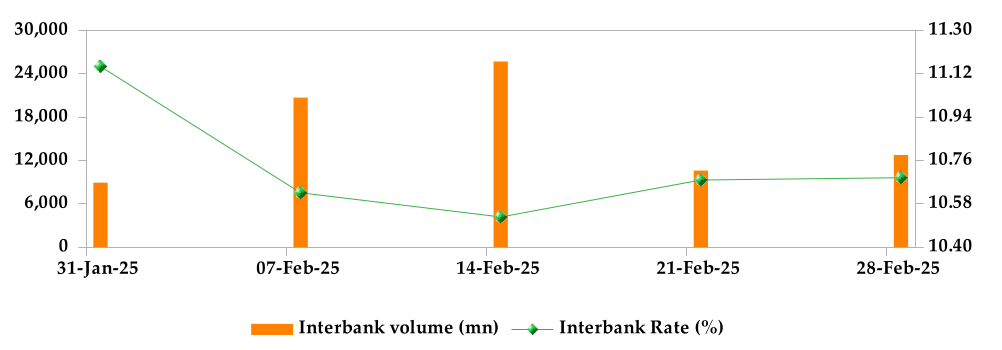
During the month, liquidity increased as a result of government payments which more than offset tax remittances. The average inter-bank rate decreased from 11.26% to 10.70%. The volume of inter-bank transactions decreased from Kshs 27.14 billion to Kshs 15.94 billion. Commercial banks excess reserves increased from Kshs 16.70 billion to Kshs 19.10 billion.
INTER-BANK RATE and VOLUME
FIXED INCOME
T-Bills
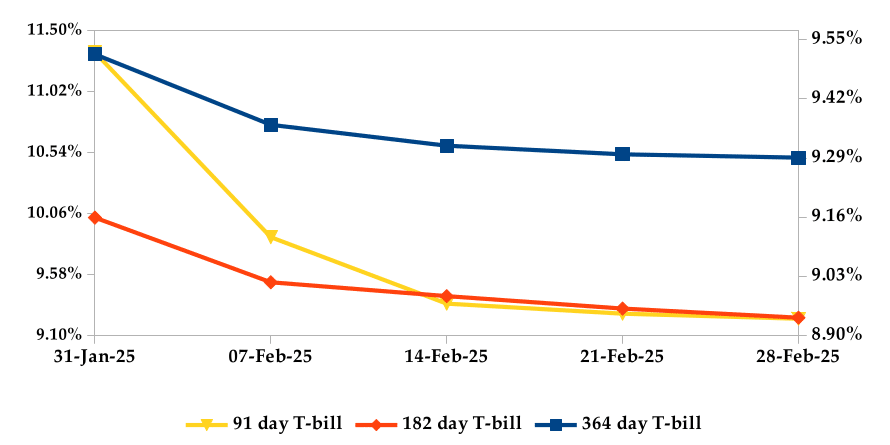
T-bills recorded an overall subscription rate of 192.64% during the month of February, compared to 94.98% recorded in the previous month. The performance of the 91-day, 182-day and 364-day papers stood at 218.79%, 167.19% and 207.62% respectively. On a monthly basis, yields on the 91- day, 182-day and 364-day papers decreased by 6.14%, 7.86% and 7.19% respectively.
T-BILLS
T-Bonds
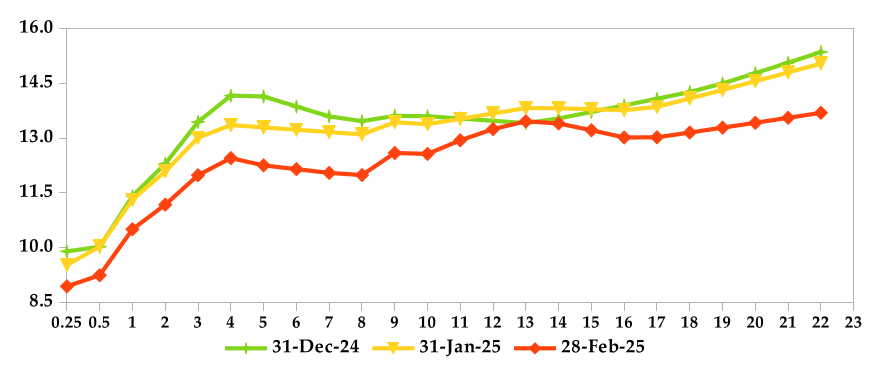
During the month, T-Bonds registered a total turnover of Kshs 250.15 billion from 3,709 bond deals. This represents a monthly increase of 59.03% and 49.50% respectively. The yields on government securities in the secondary market decreased during the month of February.
In the primary bond market, CBK issued a prospectus for the buyback of FXD1/2022/003 & FXD1/2020/005 treasury bonds and IFB1/2016/09 infrastructure bond, seeking to raise Kshs 50 billion, through a multi-price reverse auction method. The coupon rates are 11.77%, 11.67% and 12.50% respectively. Additionally, CBK re-opened the FXD1/2018/25 treasury bond in an effort to raise Kshs 25 billion. The bond has a coupon rate of 13.40%.
In the international market, yields on Kenya’s Euro bonds decreased by an average of 70 basis points.
YIELD CURVE
EQUITIES
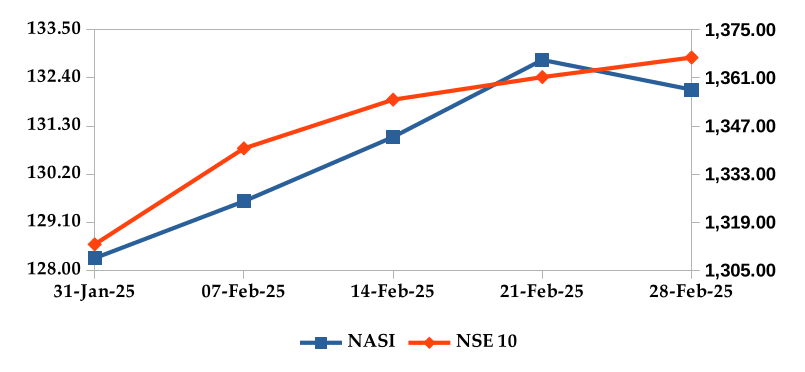
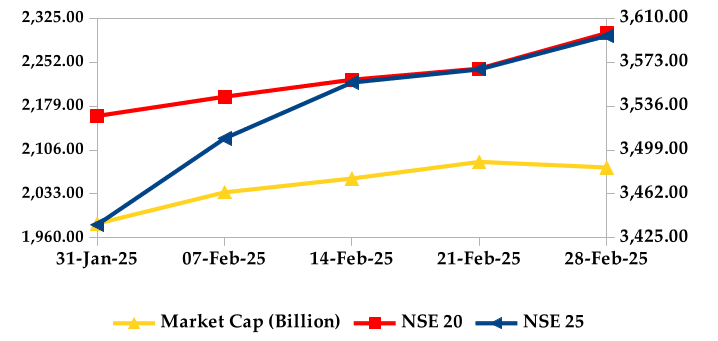
During the month, market capitalization gained 4.69% to settle at Kshs 2.08 trillion. Total shares traded decreased by 25.54% to 470.69 million shares and equity turnover decreased by 10.88% to close at Kshs 8.53 billion. On a monthly basis, NASI, NSE 20, NSE 25 and NSE 10 settled 3.00%, 6.36%, 4.63% and 4.14% higher respectively. The performance was as a result of gains recorded by large cap stocks such as Stanbic, Standard Chartered, ABSA and KCB of 9.53%, 7.81%, 5.85% and 5.15% respectively.
NASI and NSE 10
Market Capitalization, NSE 20 and NSE 25
ALTERNATIVE INVESTMENTS
GLOBAL AND REGIONAL MARKETS
| Global Markets | Monthly Change | YTD Change |
|---|---|---|
| S&P 500 | -1.42% | 1.46% |
| STOXX Europe 600 | 3.27% | 9.11% |
| Shanghai Composite (SSEC) | 2.16% | 1.79% |
| MSCI Emerging Market Index | 0.35% | 1.93% |
| MSCI World | -0.81% | 2.63% |
| Regional Markets | Monthly Change | YTD Change |
|---|---|---|
| FTSE ASEA Pan African Index | 2.12% | 7.41% |
| JSE All Share | 0.96% | 3.63% |
| NSE All Share (NGSE) | 3.18% | 4.50% |
| DSEI (Tanzania) | 2.09% | 6.01% |
| ALSIUG (Uganda) | 1.83% | 10.06% |
Get future reports
Please provide your details below to get future reports: