
Foreign Exchange Reserves
The usable foreign exchange reserves decreased by 0.38% to USD 9,143 million (4.7 months of import cover). This remains above the CBK’s statutory requirement to endeavor to maintain at least 4.0-months of import cover and above the EAC region’s convergence criteria of 4.5- months of import cover.
Currency
The Kenyan Shilling depreciated against the Dollar and the Euro, but appreciated against the Sterling Pound to exchange at KES 129.57, KES 133.34 and KES 158.32 respectively. The observed depreciation against the Dollar is attributed to a high demand for the currency.
| Currency | YTD Change | W-o-W Change |
|---|---|---|
| Dollar | 0.20% | 0.06% |
| Sterling Pound | -2.39% | -0.52% |
| Euro | -1.02% | 0.06% |
Liquidity
Liquidity in the money markets decreased, with the average inter-bank rate increasing from 11.27% to 11.31%, as tax remittances more than offset government payments. Remittance inflows totaled $445.4 million in December 2024, a 5.23% increase from $423.25 million in November 2024 and a 19.55% rise from $372.57 million in December 2023. Open market operations remained active.
| Liquidity | Week (previous) | Week (ending) |
|---|---|---|
| Interbank rate | 11.27% | 11.31% |
| Interbank volume (billion) | 34.58 | 29.92 |
| Commercial banks’ excess reserves (billion) | 28.80 | 15.10 |
Fixed Income
T-Bills
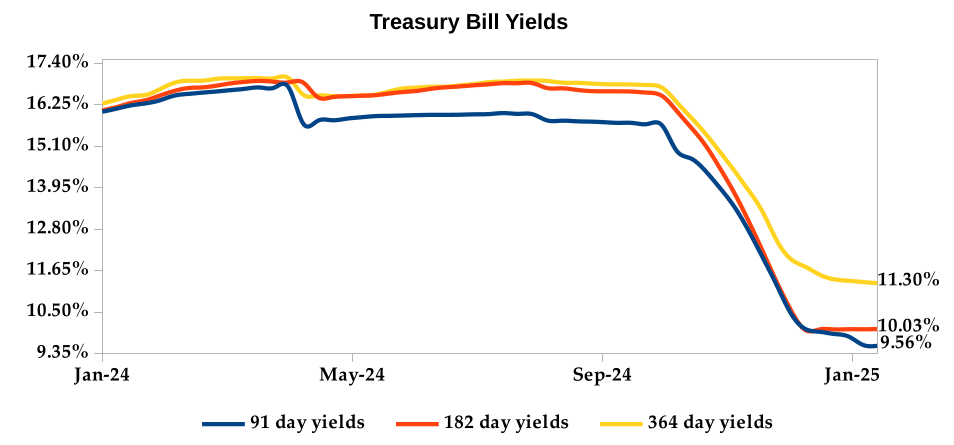
T-Bills were under-subscribed during the week, with the overall subscription rate decreasing to 78.59% from 138.10% recorded in the previous week. The 364-day T-Bill received the highest subscription rate at 100.31%, while the 91-day T-Bill and 182-day T-Bill had subscription rates of 84.57 % and 54.47% respectively. The acceptance rate increased by 30.20% to close the week at 96.08%.
T-Bonds
In the secondary bond market, there was a higher demand for the week’s bond offers. Bond turnover increased by 53.70% from KES 30.58 billion in the previous week to KES 47.01 billion. Total bond deals increased by 40.64% from 438 in the previous week to 616.
In the primary bond market, CBK released auction results for the re-opened FXD1/2018/15 and FXD1/2022/25 which sought to raise KES 30.0 billion. The issues received bids worth KES 59.00 billion, representing a subscription rate of 196.66%. Of these, KES 48.48 billion worth of bids were accepted at a weighted average rates of 14.21% and 15.68% respectively.
Eurobonds
In the international market, yields on Kenya’s Eurobonds increased by an average of 0.02% compared to the previous week, but decreased by 0.26% month-to-date and year-to-date. The yield on the 10- year Eurobond for Angola and Ivory Coast decreased.
| Bond | YTD Change | M-o-M Change | W-o-W Change |
|---|---|---|---|
| 2018 10-Year Issue | -0.27% | -0.27% | 0.01% |
| 2018 30-Year Issue | -0.18% | -0.18% | 0.08% |
| 2019 7-Year Issue | -0.27% | -0.27% | -0.08% |
| 2019 12-Year Issue | -0.28% | -0.28% | 0.03% |
| 2021 13-Year Issue | -0.26% | -0.26% | 0.06% |
| 2024 6-Year Issue | -0.29% | -0.29% | 0.03% |
Equities
NASI and NSE 20 settled 0.89% and 0.07% higher compared to the previous week, while NSE 25 and NSE 10 settled 1.16% and 0.54% lower compared to the previous week bringing the year-to-date performance to 4.35%, 4.28%, 0.37% and 0.27% respectively. Market capitalization gained 0.88% from the previous week to close at KES 2.05 trillion, recording a year-to-date increase of 4.35%. The performance was weighed down by the losses recorded by large-cap stocks such as Stanbic, ABSA and Standard Chartered of 10.67%, 10.21% and 6.58% respectively.
The Banking sector had shares worth KES 228.7M transacted which accounted for 32.45% of the week’s traded value. Manufacturing & Allied sector had shares worth KES 253.7M transacted which represented 36.00% and Safaricom, with shares worth KES 150.99M transacted, represented 21.42% of the week’s traded value.
Top Gainers and Losers in the Equities Markets
| Top Gainers | YTD Change | W-o-W |
|---|---|---|
| HF Group | 95.22% | 54.83% |
| KQ | 121.93% | 48.08% |
| Sanlam | 23.23% | 19.14% |
| Trans-Century | 25.00% | 13.64% |
| Britam | 28.18% | 13.37% |
| Losers | YTD Change | W-o-W |
|---|---|---|
| Stanbic | 0.36% | -10.67% |
| Limuru Tea | -10.29% | -10.29% |
| Absa | -9.02% | -10.21% |
| TP Serena | -5.05% | -7.38% |
| StanChart | -1.75% | -6.58% |
Alternative Investments
| Week (previous) | Week (ending) | % Change | |
|---|---|---|---|
| Derivatives Turnover (million) | 9.07 | 0.87 | -90.36% |
| Derivatives Contracts | 47.00 | 10.00 | -78.72% |
| I-REIT Turnover (million) | 0.00 | 0.00 | 0.00% |
| I-REIT deals | 0.00 | 0.00 | 0.00% |
Global and Regional Markets
| Global Markets | YTD Change | W-o-W |
|---|---|---|
| S&P 500 | 2.18% | 2.91% |
| Dow Jones Industrial Average (DJI) | 2.58% | 3.69% |
| FTSE 100 (FTSE) | 2.97% | 3.11% |
| STOXX Europe 600 | 2.54% | 2.37% |
| Shanghai Composite (SSEC) | -0.64% | 2.31% |
| MSCI Emerging Markets Index | -0.59% | 1.23% |
| MSCI World Index | 1.89% | 2.71% |
| Continental Markets | YTD Change | W-o-W |
|---|---|---|
| FTSE ASEA Pan African Index | 2.89% | 0.42% |
| JSE All Share | 0.57% | 1.82% |
| NSE All Share (NGSE) | -0.80% | -2.94% |
| DSEI (Tanzania) | 1.68% | 0.26% |
| ALSIUG (Uganda) | 6.16% | 2.08% |
Global and Continental Markets
The US stock market posted gains during the week, buoyed by investor expectations of potential Federal Reserve interest rate cuts later this year. This optimism was fueled by recent economic data such as softer-than-expected core inflation, producer price index (PPI) and retail sales figures.
European stock markets closed the week in the green zone, as investors digested the declining government bond yields as well as the heightened merger activity in the mining sector.
Asian stock markets closed the week higher, boosted by positive economic data from China. Industrial production grew stronger than expected, primarily driven by recent stimulus measures from Beijing. Retail sales also exceeded expectations, indicating a rebound in consumer spending.
On the global commodities markets, Crude Oil WTI and ICE Brent Crude closed the week 1.07% and 1.29% higher at $77.39 and $80.79 respectively. Gold futures prices also settled 1.24% higher at $2,748.70.
Week’s Highlights
- The National Treasury gazetted revenue and net expenditures data for the the sixth month of the FY 2024/25, ending 31st December 2024. Total revenue collected amounted to KES 1,160.17 billion, representing 39.77% of the original KES 2.92 trillion target. This was 20.46% lower than the projected KES 1,458.60 billion for the period. Total expenditure reached KES 1,714.07 billion, which was 39.66% of the original estimate, resulting in a fiscal deficit of KES 553.89 billion. To finance this deficit, the government borrowed KES 574.39 billion, with domestic and external borrowings constituting 83.85% and 16.15% respectively.
- The Energy and Petroleum Regulatory Authority (EPRA) released its latest monthly statement on the maximum retail prices of petroleum products, effective from 15th January 2025 to 14th February 2025. The pump prices of super petrol, diesel and kerosene increased by KES 0.29, KES 2.00 and KES 3.00 to KES 176.58, KES 167.06 and KES 151.39 per litre respectively.
- Actuarial Services E.A. Limited 1113 Kayahwe Rd, Off Galana Rd, Kilimani, P. O. Box 10472 – 00100 NAIROBI, KENYA Tel. +254 202 710 028 / Cell: +254 111 037 100 / +254 708 710 028 / +254 785 710 028 Office Email: info@actserv-africa.com Website: www.actserv.co.ke The National Treasury projected Kenya’s economic growth for 2025 at 5.3%, slightly below the Central Bank of Kenya’s December 2024 forecast of 5.5%. The Central Bank had cited resilience in key sectors like services and agriculture, along with improved exports, as drivers of growth. However, the National Treasury notes that economic growth slowed in the first half of 2024, averaging 4.8% compared to 5.5% in the same period of 2023. Third-quarter growth further decelerated to 4%, the slowest pace in four years, due to contractions in sectors like construction and mining.
- Kenya and the United Arab Emirates (UAE) have signed a comprehensive trade agreement aimed at boosting bilateral trade. The deal seeks to eliminate trade barriers and expand market access for Kenyan exports, particularly in horticulture and meat products. In return, Kenya will significantly increase imports from the UAE, including petroleum, machinery and chemicals, traditionally sourced heavily from China. This agreement has the potential to diversify Kenya’s import sources and enhance its economic ties with the UAE. Bilateral trade between the two countries reached KES 445 billion in 2023, with the UAE becoming Kenya’s sixth-largest export destination.
- UK inflation eased to 2.5% in December 2024 from 2.6% in November, below market expectations. This aligns with the Bank of England’s November forecast. Price growth slowed in key sectors like restaurants & hotels, recreation & communication and services. However, slower declines in transport costs partially offset these downward pressures. Core inflation also moderated, falling to 3.2%. On a monthly basis, consumer prices declined to 3.2%, from 3.5% in the previous month.
- US inflation rose to 2.9% in December 2024 from 2.7% in November, marking the third consecutive monthly increase and aligning with market expectations. This uptick was partly driven by base effects from last year’s sharp energy prices declines. Energy costs rose significantly, with gasoline prices increasing notably. Food and transportation costs also accelerated. While shelter inflation moderated and used car prices continued to decline, these factors were not enough to offset the broader inflationary pressures. On a monthly basis, the Consumer Price Index (CPI) increased by 0.4%, exceeding market expectations, with energy prices accounting for over 40% of the monthly increase.
- The British economy grew by 0.1% in November 2024, rebounding from a 0.1% decline in both October and September, falling short of market expectations of a 0.2% increase. This was primarily driven by a modest expansion in the services sector, particularly in accommodation & food services, computer programming and telecommunications. However, the production sector contracted, weighed down by manufacturing decline.
- 5 China’s economy grew by 5.4% year-on year in Q4 2024, from 4.6% in the previous quarter, exceeding expectations of 5.0% and marking the strongest growth in 18 months. This acceleration was fueled by government stimulus measures. Key indicators like industrial production and retail sales showed improvement, although unemployment ticked higher. Exports surged, driven by pre-emptive shipments ahead of potential US tariffs, while imports also increased significantly. For the full year, GDP grew by 5.0%, meeting the government’s target but slower than 2023. Fixed investment expanded at a faster pace in 2024.
Get future reports
Please provide your details below to get future reports:
[fluentform id=”3″]